QUESTION:
Find the probability that a single person ( sample size n = 1) gets a test value BETWEEN 74 and 78 for their exam score. Assume that the exams are normally distributed with a mean of 82 and a std dev of 4.
NOTE: This question will use the “z table”
Here is a great z – table:
http://www.stat.ufl.edu/~athienit/Tables/Ztable.pdf
There is also a z table in the back of any statistics book 😉
ANSWER:
First, let’s look at what we are given in the problem:
1) We are told that the mean = 82
2) We are told that the std dev = 4
3) We are told that our sample comes from a normally distributed population which means that we can use the z table to determine probabilities (percentages or also sometimes called area under the curve).
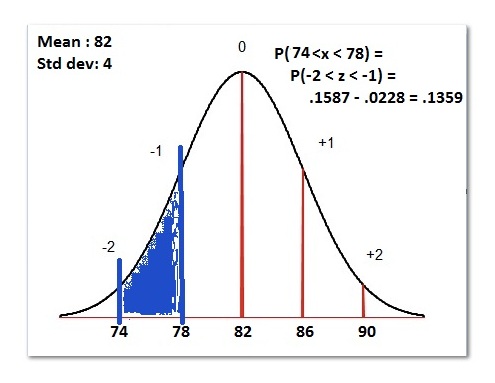
This image is what we are doing:
Anytime you are asked to find the probability, percentage, or area under the curve (these all mean the same thing) for a normal distribution, you will use the z table.
The z table is a table of probabilities for each z value (a z value is the number of standardized deviation you are from the mean).
To use the z table, you must first convert (standardize) the values in your question to z values.
Here is how:
Our first value here is 74
How many std dev from the mean is 74?
Visually, we can see that it is -2 std dev from the mean.
We can also use the formula for z to get this:
z = (x – mean)/std dev
z = (74 – 82) / 4 = – 8/4 = -2
Therefore, the value 74 in our problem is the same as z = -2
Next, we do the same thing for the value 78.
Why are we doing this for 74 and 78? Because the question is asking for the probability that a score is BETWEEN 74 and 78. We will use the z table to get this, but not until we convert 74 and 78 to their equivalent z values.
The z value for 78, visually is -1. You can see this by looking at the image above and noting that 78 is -1 deviation from the mean.
The z formula confirms this:
z = (x – mean)/std dev
z = (78 – 82)/ 4 = -4/4 = -1
So, the z value for 78 is -1
This tells us that
P( 74 < x < 78) is the same exact thing as P(-2 < z < -1)
Using the z table, we will need to do two things.
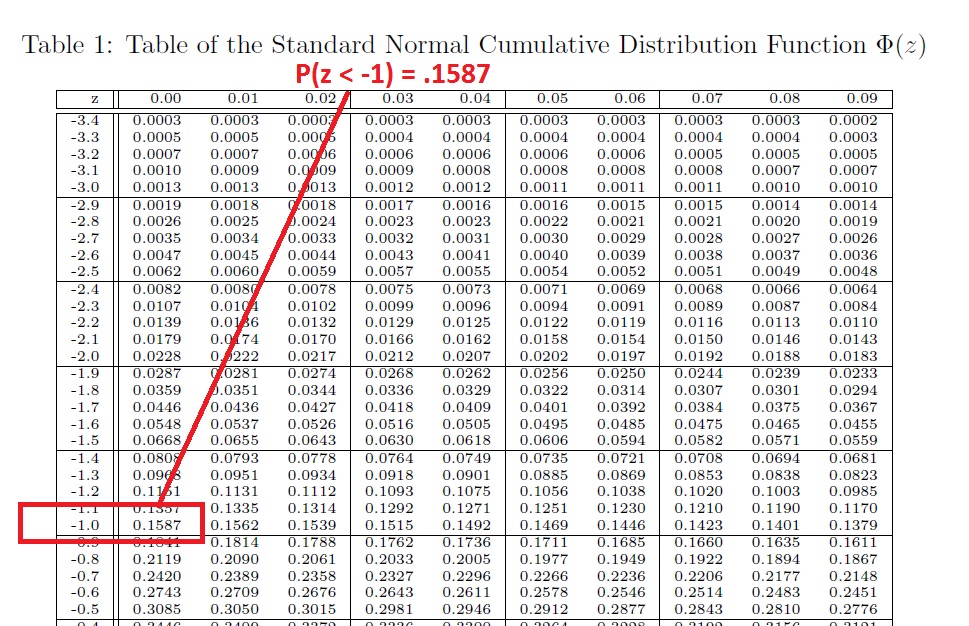
IMPORTANT NOTE: the z table is cumulative and always starts on the left.
So the P(z < -1) is .1587
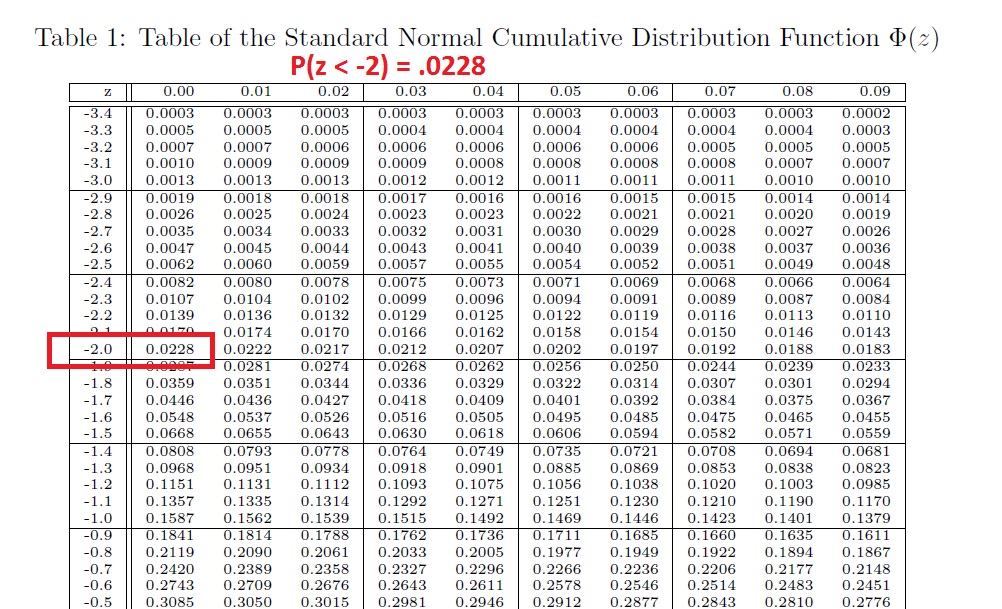
Next, we need the P(z < – 2)= .0228
But this question is asking for the Probability that a value is BETWEEN 74 and 78 (which is the same as BETWEEN z = -1 and -2).
P(74 < x < 78) = P(-2 < z < -1) = .1587 – .0228 = .1359
Final Solution:
Therefore, the Probability that a single student will get a score between 74 and 78 is .1359 or about 13.5%.
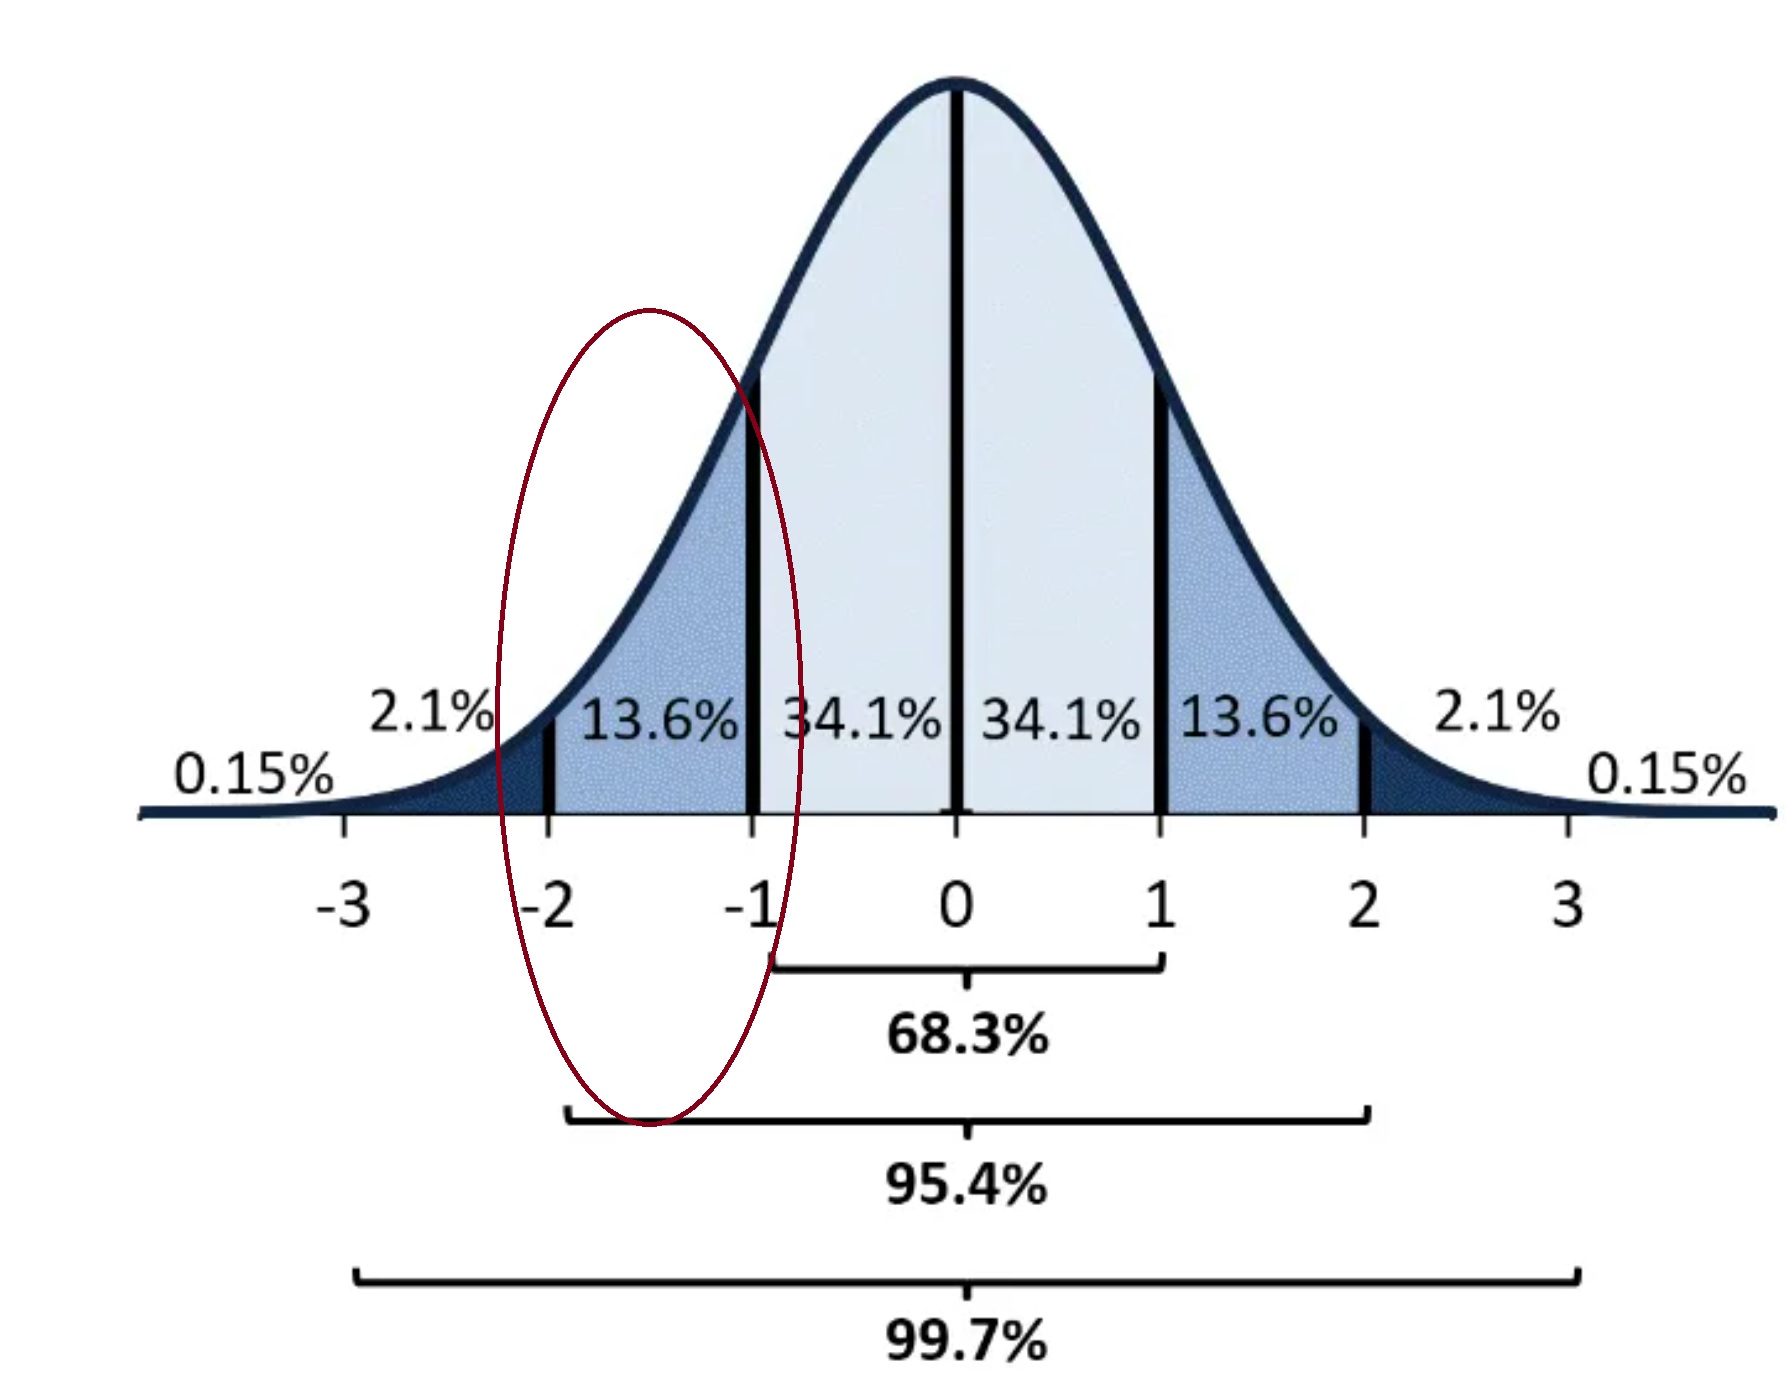
This matches what is expected if you were to use the Empirical Rule (the 68-95-99 Rule) instead. Try this to check 🙂