
Example:
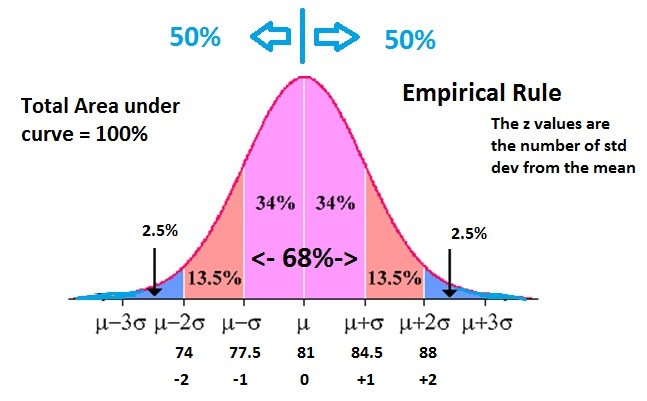
Suppose a teacher has collected all the final exam scores for all statistics classes she has ever taught. This dataset is normally distributed with a mean of 81 and a std dev of 3.5.
Using this information, estimate the percentage of students who will get the following scores using the Empirical Rule (also called the 95 – 68 – 34 Rule and the 50 – 34 – 14 Rule):
a) Probability that a score is above 81?
In this example, the mean of the dataset (the average score) is 81. Therefore, 50% of students are expected to score above this value and 50% below. The answer here is 50%
b) Probability that a score is below 81?
In this example, the mean of the dataset (the average score) is 81. Therefore, 50% of students are expected to score above this value and 50% below. The answer here is 50%
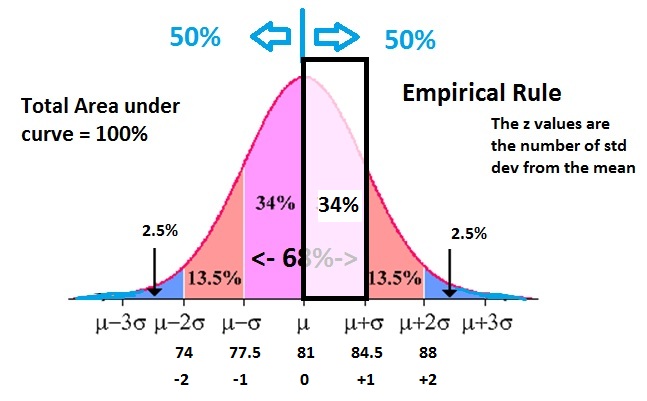
c) Probability that a score is between 81 (the mean) and 84.5?
Here, 81 is the mean, so we know that 50% of the class is below this point. Next, the score of 84.5 is a one standard deviation above the mean. Why? Because each deviation in this question is “3.5” points. So, a score of 84.5 is 81 + 3.5 or one deviation above the mean.
Using the Empirical Rule, we can see that about 34% of scores are BETWEEN the mean and the first deviation. So there is 34% chance that a student will score between 81 and 84.5.
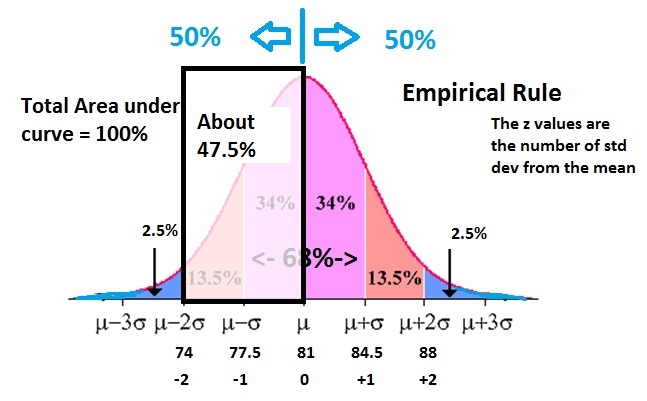
d) Probability that a score is between 81 (the mean) and 74?
Here, 81 is the mean, so we know that 50% of the class is below this point. Next, the score of 74 is a two standard deviations BELOW the mean. Why? Because each deviation in this question is “3.5” points. So, a score of 74 is 81 – 3.5 – 3.5 = 74 or TWO deviations below the mean.
Using the Empirical Rule, we can see that about 34% + 14% of scores are BETWEEN the mean and the second deviation below it. So there is a 34% + 14% = 48% chance that a student will score between 81 and 74.
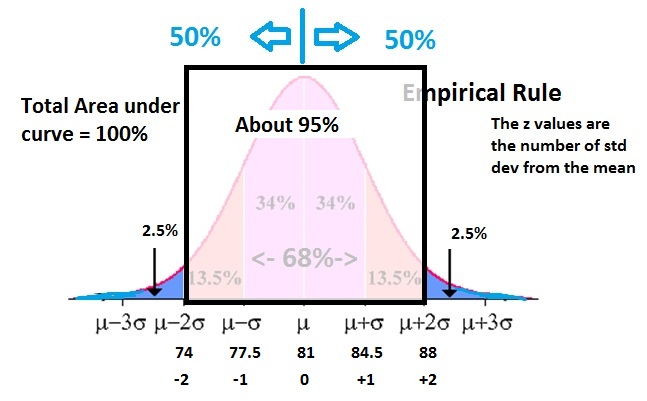
e) Probability that a score is between 74 and 88?
Here, 74 is two deviation below the mean and 88 is two deviations above the mean. Using the Empirical Rule, we can see that about 14% + 34% + 34% + 14% of scores are BETWEEN 74 and 88 and to there is a 95% chance that a score will be between 74 and 88.
f) Probability that a score is above 88?
Here, 88 is two deviations above the mean. To score ABOVE 88 there is only a 2.5% chance.
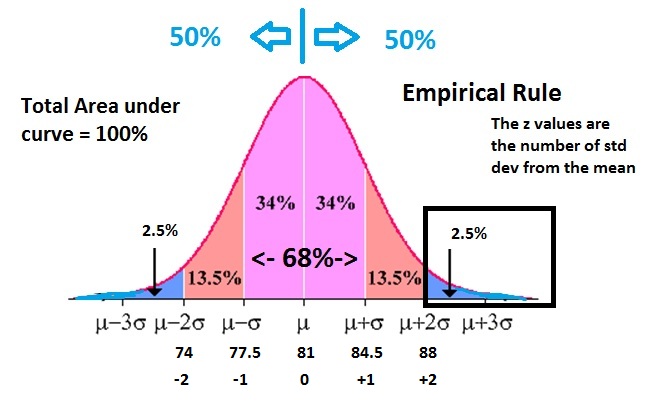
NOTICE: These examples use the Empirical Rule to Estimate the Probability. However, the z value (also called z score) and z table can be used to get the exact probability for any score.
Using the z Table and z Value for Percentages and Probability