
ANOVA Testing Example
See a HOW TO Video of this Example
A research study compared the ounces of coffee consumed daily between three groups. Group1 was Italians, Group 2 French, and Group 3 American. Determine if there is a significant difference among the groups using a 5% level (alpha is .05).
Group1: Italian
Group 2: French
Group 3: American
The Results of this study are in the following table:
| Group 1 | Group 2 | Group 3 | |
| n (sample size) | 70 sample size 1 | 70 sample size 2 | 70 sample size 3 |
| M | 4.0 sample mean 1 | 3.7 sample mean 2 | 3.4 sample mean 3 |
| s^2 | 4.4 variance for group 1 | 5.2 variance for group 2 | 6.1 variance for group 3 |
Note that here in this example:
“n” is the sample size for each group
“M” is the “sample mean” for each group
“s^2” is the sample variance for each group
N = n1 + n2 + n3 = 70+ 70+70 = 210
NOTE that “N” is the combined sample size for all three groups.
Step 1: The null and alternative hypothesis Ho and Ha
Ho (the null) will represent that all the groups are statistically the same.
Ho: mean group 1 = mean group 2 = mean group 3
The Ha (alternative or research) hypothesis will represent that at least one of the groups is statistically significantly different.
Ha: mean group 1 ≠ mean group 2 ≠ mean group 3
Step 2: Determine the “degrees of freedom” also called df for each group and for the combination of groups:
The df BETWEEN is calculated by subtracting 1 from the number of groups you have. We have three groups here.
df BETWEEN = 3 – 1 = 2 (Used as the numerator or top df)
Next, the df WITHIN is calculated by first determining the individual df for each group and then adding them together:
df group1 = 70 – 1 = 69
df group 2 = 70 – 1 = 69
df group 3 = 70 – 1 = 69
df WITHIN = 69 + 69 + 69 = 207 (Used as the denominator or bottom df)
Step 3: Use the F-Table or a technology to get the “cut-off” values for this F-test ANOVA. Remember that all hypothesis tests have cut-off values that you use to determine if your F-test result is in the rejection region or not.
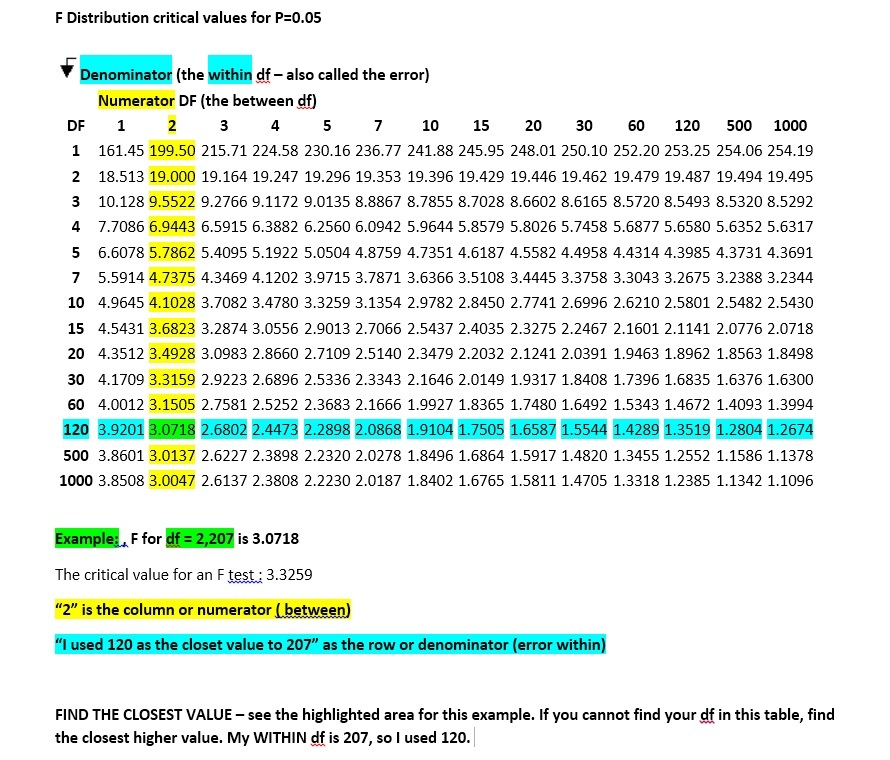
NOTE: The F-Table cannot contain all possible values. So most F Tables contain some values and you will choose the closet value to your df numbers.
IMPORTANT: Because of this, different textbooks or examples will have slightly different cut-off values for their F-tests. In this case, I am using the table below and my cut-off value is 3.07. However, a similar example might have a cut-off of 3.09 for example.
To get a more exact cut-off, use Excel to run the ANOVA. Excel will generate the p values for you.
Excel Example of ANOVA
Therefore, our cut-off value for the F-test is 3.07 here.
Step 4: Run the F-test to determine the F values. Then compare the F test value results to the cut-off values.
Running an F-test by hand has a few steps.
First Step:
Calculate the grand mean (GM) = (4.0 + 3.7 + 3.4) / 3 = 3.7
This grand mean is the sum of all of your individual means, divided by the total number of your groups. We have three groups. So we add the three group means together and divide by 3.
Second Step
Calculate the variance of the means. NOTE that 3.7 is the grand mean. Note that 4.0, 3.7, and 3.4 are individual group means. Note that “2” is the df BETWEEN.
s^2M = ( [ 4.0 – 3.7 ]^2 + [3.7 – 3.7 ]^2 + [3.4 – 3.7]^2 ) / dfBETWEEN
= ( [ 4.0 – 3.7 ]^2 + [3.7 – 3.7 ]^2 + [3.4 – 3.7]^2 ) / 2
= ( [ .3 ]^2 + [0 ]^2 + [-.3]^2 ) / 2
= ( .09 + 0 + .09 ) / 2
= .18/2
= .09
What did we do here?
The s^M is computed by subtracting the grand mean in this problem of 3.7 that we calculated in the first step from each individual group mean. Then, we squared each difference. Then, we added those results. Then, we divided by the dfBETWEEN which is 2 in this example.
Do not let formulas scare you.
Third Step
Next, we can calculate the variance between the groups or s^2BETWEEN
s^2 BETWEEN = s^2M*n = .09 * 70 = 6.3
Remember, the s^2M was just calculated in the second step. The “n” is the size of each group sample. If your groups are different sizes, use the average size.
Fourth Step
Now we will calculate the WITHIN variance called s^2WITHIN
s^2WITHIN = (4.4 + 5.2 + 6.1)/3 = 5.233
Where did these numbers come from?
Here, these are the three individual variances of each group. See the table at the start of the example. You will see that Group 1 has a variance (s^2) of 4.4 and group 2 has a variance or 5.2, and group 3 has a variance of 6.1. To get the average of the three group variances, we add them together and divide by 3. This is what we did here in the fourth step.
Last Step!
Now we are ready to calculate F because we have calculated all the parts that we need for F.
F = s^2BETWEEN / s^2WITHIN
F = 6.3/5.233 = 1.20
What did we do here?
The s^2 BETWEEN is what we calculated in the third step above and the s^2WITHIN is what we calculated in the fourth step above.
The F test is the between variance divided by the within variance.
Our F-test result here is 1.20
Step 5: Determine the final result and conclusion for your ANOVA F-test
The F-test is 1.20.
The cut-off value is 3.07
We can reject Ho only when our test value (1.20 in this case) is LARGER THAN our cut-off value (3.07 in this case).
However, in our example here, the F-test < cut-off
1.20 < 3.07
Therefore we CANNOT reject Ho
In conclusion, there is NOT a significant difference between our three groups.
We can say there is not enough evidence to conclude that people from the three groups of Italian, French, and American drink a sig diff amount of coffee per day. Therefore, statistically, we say that the amount of coffee consumed by these groups is NOT sig diff.
NOTE: These results are made up and are pretend. This is not a real test, nor a real conclusion. This is pretend and only for example purposes.